

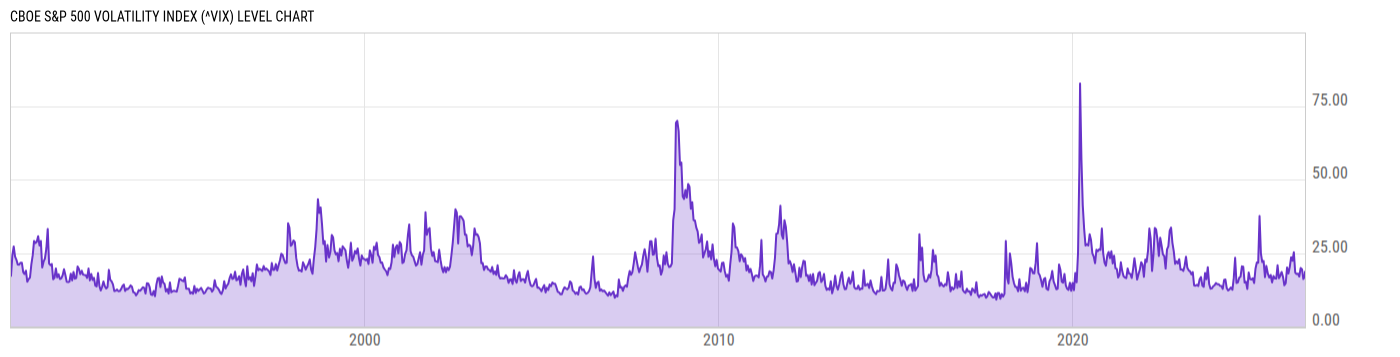
CBOE S&P 500 Volatility Index (^VIX)
18.58
-0.12
(-0.64%)
USD |
Jul 24, 20:00
Level Chart
Key Stats
Basic Info
| The VIX Index is a calculation designed to produce a measure of constant, 30-day expected volatility of the U.S. stock market, derived from real-time, mid-quote prices of S&P 500® Index (SPX℠) call and put options. On a global basis, it is one of the most recognized measures of volatility -- widely reported by financial media and closely followed by a variety of market participants as a daily market indicator. | |
| Core Index Name | CBOE S&P 500 Volatility Index |
| Return Type | Price Return |
| Currency Code | USD |
| Category Hedge Type | Not Hedged |
Total Return Performance
Returns for periods of 1 year and above are annualized.
Annual Performance
As of July 25, 2026.
Basic Info
| The VIX Index is a calculation designed to produce a measure of constant, 30-day expected volatility of the U.S. stock market, derived from real-time, mid-quote prices of S&P 500® Index (SPX℠) call and put options. On a global basis, it is one of the most recognized measures of volatility -- widely reported by financial media and closely followed by a variety of market participants as a daily market indicator. | |
| Core Index Name | CBOE S&P 500 Volatility Index |
| Return Type | Price Return |
| Currency Code | USD |
| Category Hedge Type | Not Hedged |